


Preview
What it is.
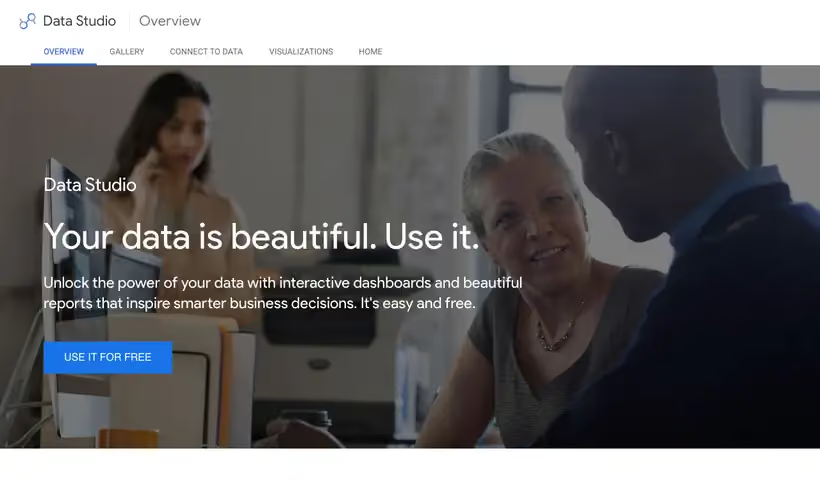
Build the report once and it stays current, because Looker Studio reads Google's own sources directly and shares by link. Creating and viewing both cost nothing on the self-service tier.
It also quietly solves the export problem behind half the free tools you'd pair it with. Search Console hands out 50K rows of data per day through its API, and a dashboard reads that directly, so nobody downloads a CSV every Monday.
What you get.
- A live dashboard across Search Console, GA4, Ads, plus Sheets, with no connector fee.
- Filters and date controls, so viewers answer their own follow-up questions.
- Paid spend and organic clicks blended in one table, which settles the channel argument.
- A scheduled PDF for the people who would rather get an email.
How to set it up.
Start from a blank report and add the Search Console connector, choosing the Site Impression table for query data.
Add a date range control and a filter control at the top, so viewers can answer their own follow-up questions.
Blend GA4 sessions with Search Console clicks on the landing page field to see where organic traffic converts.
Set the report's data freshness to 12 hours to cut connector calls on a heavy dashboard.
Share by link with view access, then schedule a PDF for the people who prefer email.
Pricing Plans
Looker Studio
$0
self-service reports and dashboards, free to build and view
Looker Studio Pro
$9
per user per project per month, with support and admin features
Use cases
Retire the monthly deck
Wire your search and ads data into one link and stop rebuilding slides.
Let viewers answer themselves
Add date and segment controls so follow-up questions never reach your inbox.
Paid and organic together
Put spend beside organic clicks on one page for a channel review.
Best for
Client and board reporting
A shared link that updates itself beats a slide deck someone rebuilds every month, and viewers cost nothing.
Getting past export caps
The Search Console connector reads the API, so a dashboard sees more query rows than the interface hands over.
One view across paid and organic
Blending Ads spend with organic clicks in one table settles the argument about which channel moved.
Open the tool
Opens on Google in a new tab.