


Preview
What it is.
You tell it whether you are building an executive summary or an operational report, and it designs the layout, the interactive controls, the theme and the mobile view for that one audience.
Date range controls and a saved theme are what stop the monthly rebuild. Serving both audiences from one page is the usual reason a dashboard goes unopened.
What you get.
- A split between executive and operational dashboard design
- Layout and visual hierarchy guidance
- Interactive controls: date selectors, filters and drill-downs
- Consistent theming across reports
- Mobile-responsive layout as a stated requirement
How to set it up.
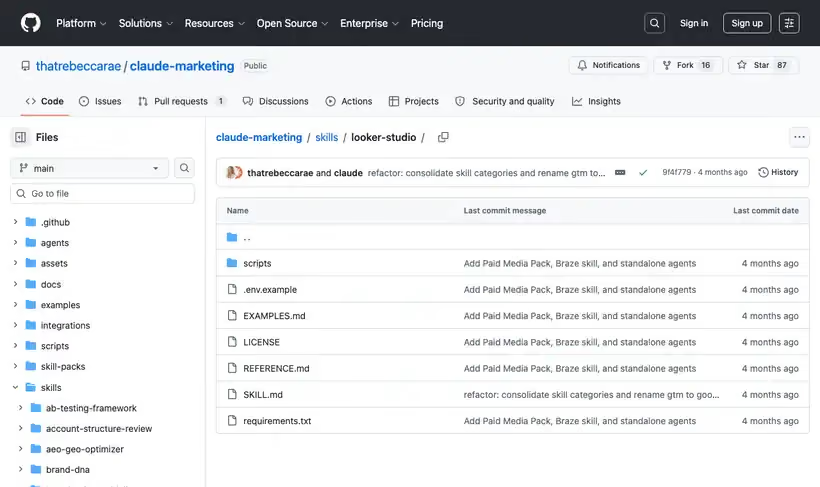
Clone the repo and copy skills/looker-studio into ~/.claude/skills.
Decide which dashboard you are building before you place a chart. Executive and operational are different products with different densities.
Put the two or three numbers an executive needs at the top left, because a reader starts there.
Add date range controls and not hard-coded periods, which is what stops the monthly rebuild.
Set a theme once and apply it across every report, so a stakeholder can tell your dashboards apart from someone else's.
Check it on a phone before sharing. A weekly report is read on mobile more often than on a laptop.
Pricing Plans
Free. MIT license.
Looker Studio itself is free to use. Checked against the repo in July 2026.
Use cases
Splitting a two-audience dashboard
One page tries to serve the executive and the channel manager at once. Name the two audiences and it comes back as two designs, each with its own density and hierarchy.
Ending the monthly rebuild
Every month someone rebuilds the report with new dates. Swap the hard-coded periods for date range controls and save the theme, and the rebuild disappears.
Client reports that look owned
Dashboards from your team all look different from each other. Set the theme once through the skill and every report you send carries it, so a client recognizes your work on sight.
The phone test
The weekly report gets read on trains more than on laptops. Check the layout on a phone before sharing, because mobile responsiveness is a stated requirement here and desktop-only layouts fail it.
Best for
A dashboard nobody opens
Usually built for two audiences at once. The executive and operational split solves it.
Monthly reporting you rebuild by hand
Date range controls and a saved theme remove most of the repeat work.
Client-facing reports
Consistent theming plus mobile layout is what makes a report look like a product instead of a screenshot.